Table of Contents
In this article, you’ll learn about PathPatch ,3D plotting and StreamPlot in Mathplotlib using Python with examples.
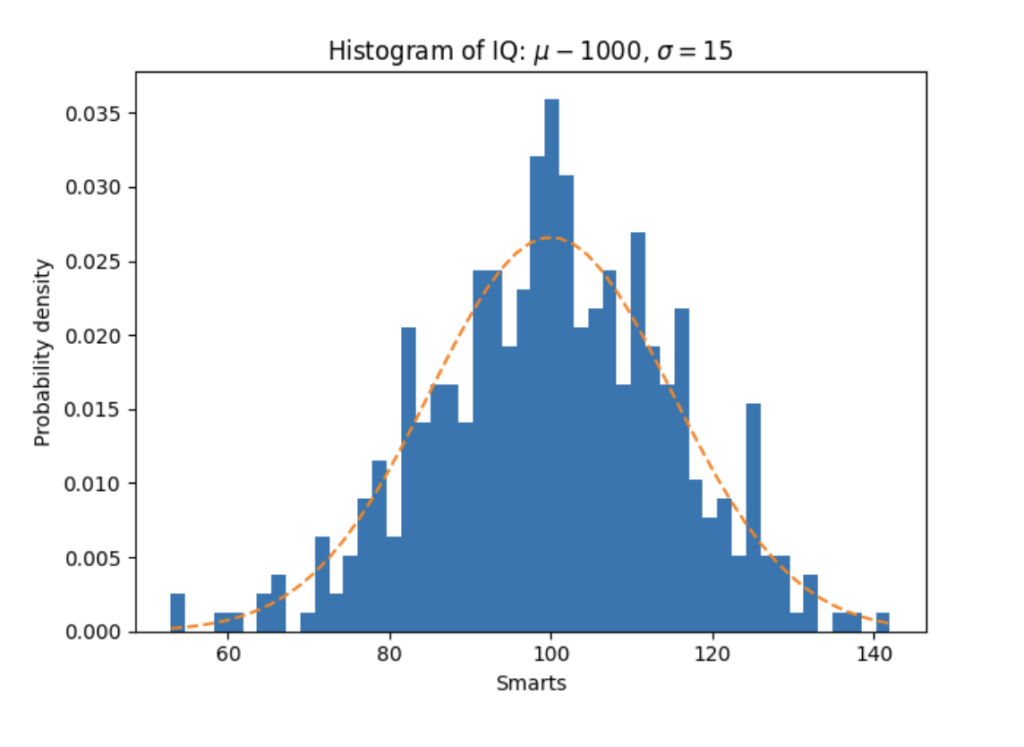
Histograms
The hist() function generates histograms automatically and returns the bin counts or probabilities. This demo shows a few optional characteristics in addition to the basic histogram:
- Setting the number of data bins.
- The parameter of density, Which normalises the height of the bin so that the histogram integral is 1.
- The resulting histogram is an approximation of the probability density function.
- Setting the face color of the bars. Setting the opacity (alpha value).
import matplotlib
import numpy as np
import matplotlib.pyplot as plt

np.random.seed(19680801)

# example data
mu = 100 # mean of distribution
sigma = 15 # standard deviation of distribution
x = mu + sigma * np.random.randn(437)

num_bins = 50
fig, ax =plt.subplots()

# the histogram of the data
n, bins, patches = ax.hist(x, num_bins, density=True)
# add a 'best fit' line
y = ((1 / (np.sqrt(2 * np.pi) *sigma))* np.exp(-0.5* (1 / sigma *(bins - mu))**2))
ax.plot(bins, y, '--')
ax.set_xlabel('Smarts')
ax.set_ylabel('Probability density')
ax.set_title(r'Histogram of IQ: $\mu-1000$, $\sigma=15$')
# Tweak spacing to prevent clipping of ylabel
fig.tight_layout()
plt.show()
Output:

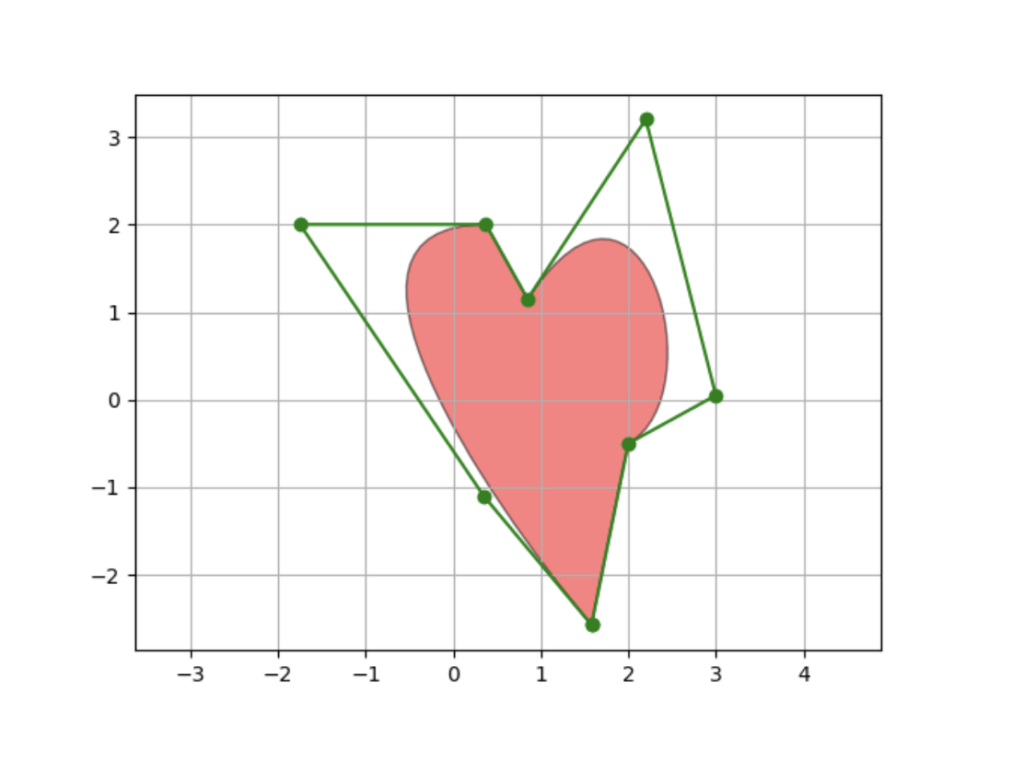
PathPatch object
In Matplotlib, you can use the matplotlib. path module to add arbitrary paths:
import matplotlib.path as mpath
import matplotlib.patches as mpatches
import matplotlib.pyplot as plt

fig, ax = plt.subplots()

Path = mpath.Path
path_data = [ (Path.MOVETO, (1.58, -2.57)),
                         (Path.CURVE4, (0.35, -1.1)),
                         (Path.CURVE4, (-1.75, 2.0)),
                         (Path.CURVE4, (0.375, 2.0)),
                         (Path.LINETO, (0.85, 1.15)),
                         (Path.CURVE4, (2.2, 3.2)),
                         (Path.CURVE4, (3, 0.05)),
                         (Path.CURVE4, (2.0, -0.5)),
                         (Path.CLOSEPOLY, (1.58, -2.57)),]

codes, verts = zip(*path_data)
path = mpath.Path(verts, codes)
patch = mpatches.PathPatch(path, facecolor='r', alpha=0.5)
ax.add_patch(patch)

# plot control points and connecting Lines
x, y = zip(*path.vertices)
line = ax.plot(x, y, 'go-' )

ax.grid()
ax.axis('equal')
plt.show()
Output:

Three-dimensional plotting
The mplot3d toolkit (see Getting Started and 3D Plotting) supports simple surface-inclusive 3d graphs with wireframe, scatter and bar charts.
import matplotlib.pyplot as plt
from matplotlib import cm
from matplotlib.ticker import LinearLocator
import numpy as np

fig, ax = plt.subplots(subplot_kw={"projection": "3d"})

# Make data.
X = np.arange(-5, 5, 0.25)
Y = np.arange(-5, 5, 0.25)
X, Y = np.meshgrid(X, Y)
R = np.sqrt(X**2 + Y**2)
Z = np.sin(R)

# Plot the surface.
surf = ax.plot_surface(X, Y, Z, cmap=cm.coolwarm, linewidth=0, antialiased=False)

# Customize the z axis.
ax.set_zlim(-1.01, 1.01)
ax.zaxis.set_major_locator(LinearLocator(10))
# A StrMethodFormatter is used automatically
ax.zaxis.set_major_formatter('{x:.02f}')

# Add a colour bar that maps the colours to the values.
fig.colorbar(surf, shrink=0.5, aspect=5)

plt.show()
Output:

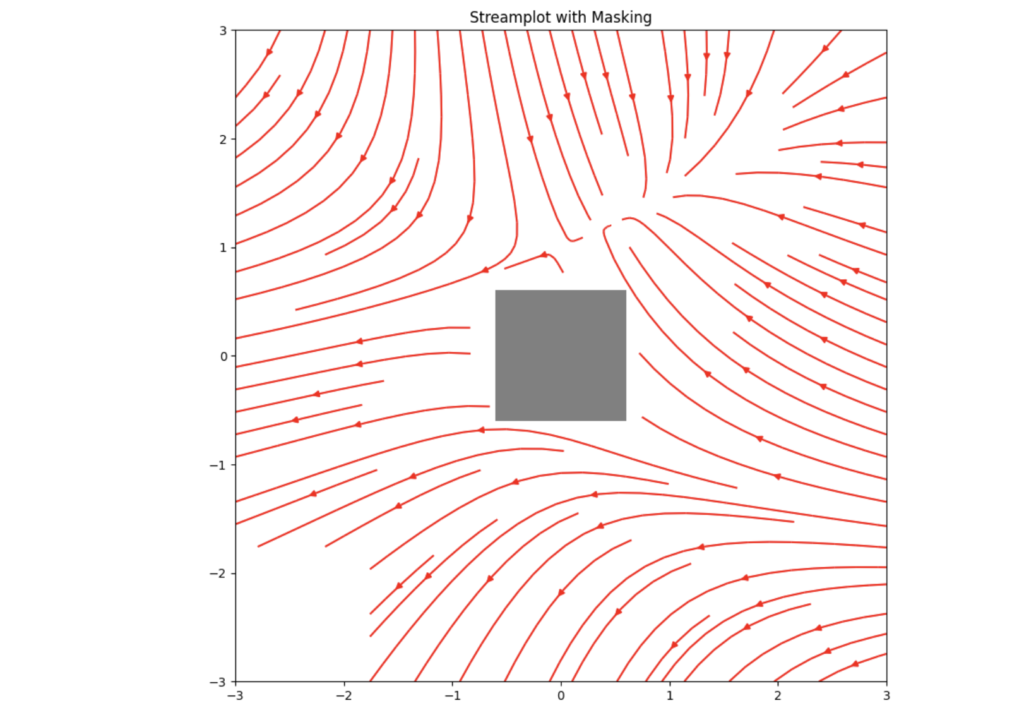
Streamplot
For displaying 2D vector fields, a stream plot or streamline plot is used. A few features of the streamplot function are shown in this example:
Varying the color along a streamline. Varying the density of streamlines. Varying the line width along a streamline. Controlling the starting points of streamlines. Streamlines skipping masked regions and NaN values.
import numpy as np
import matplotlib.pyplot as plt
import matplotlib.gridspec as gridspec

# Creating dataset
w = 3
Y, X = np.mgrid[-w:w:100j, -w:w:100j]
U = -1 - X**2 + Y
V = 1 + X - Y**2
speed = np.sqrt(U**2 + V**2)

fig = plt.figure(figsize =(20, 16))
gs = gridspec.GridSpec(nrows = 3, ncols = 2, height_ratios =[1, 1, 2])

# Create a mask
mask = np.zeros(U.shape, dtype = bool)
mask[40:60, 40:60] = True
U[:20, :20] = np.nan
U = np.ma.array(U, mask = mask)

ax = fig.add_subplot(gs[2:, :])
ax.streamplot(X, Y, U, V, color ='r')
ax.set_title('Streamplot with Masking')

ax.imshow(~mask, extent =(-w, w, -w, w), alpha = 0.5,
		interpolation ='nearest', cmap ='gray', aspect ='auto')
ax.set_aspect('equal')

plt.tight_layout()
plt.show()
Output:

Hope you enjoyed this article on PathPatch,3D plotting & StreamPlot in Matplotlib, Happy Programming 🙂

3 comments
I just couldn’t go away your website before suggesting that I really
enjoyed the standard information an individual provide in your guests?
Is going to be again regularly to check out new posts
Subscribe to our Newsletter!
Hi there, just wanted to say, I liked this article.
It was inspiring. Keep on posting!
Comments are closed.